Imputing in pandas with `.groupby`.
Finally, another post about pandas (and Tableau)! Last time, as I saw the time before that when I made multiple posts in one day, I had to add timestamps to the YAML front matter to get the posts to display in the correct order. Wasn’t working for my last two posts until I changed the times to earlier times. Turns out the time I write is the local time, so even if I write date: 2024-07-24 18:00:00 -06:00, which should be noon Mountain Time, it doesn’t work if 6p MT hasn’t occurred yet. Confusing, but I guess it works now.
Now for the star method in cleaning my data: .groupby
Wonderful method, turns out it does exactly what I need! Here is the article I read that describes how to use the .groupby method. I believe I’d seen it used before by people at Erdős Institute, but I didn’t really understand how it works. Remember that block of code from my last post? This code does the same thing:

The .reset_index method is what makes the new data frame with the new column, and then .merge does the inner join of the original data frame with that one. I don’t even think I had to sort the rows in the original data frame to get the inner join to work properly.
So just to check that I got the same result that I did when I did it by brute force, I ran .nunique and got 908 values for ‘daily_averages’ and 925 for ‘daily_average’. But I “inspected” the Excel file and the columns look identical. Then I ran:
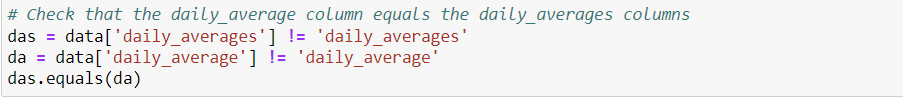
… and got True. I believe it! But I should look up .nunique again and see exactly what it does.
But all of the above happened a few weeks ago, it’s been rough trying to get on with this project. What’s happened since then? Well, I’ve decided that in Tableau I’d like to display rolling polling averages for Donald Trump, Joe Biden, and Kamala Harris, among likely voters, registered voters, and all voters. So I actually no longer need the daily_averages column. Looks like another job for .groupby!
The main issue I ran into, as I mentioned in the last post, was that in Tableau the data plot looks really choppy without imputing data. Then I wanted to add a trendline, but the polynomial trendlines in Tableau look way too wacky. I need a way to “connect the dots”, but smoothly. A rolling average! Wasn’t sure what size window to use at first, but ultimately decided on 7 days.
Here’s how I imputed. First, the function that inserts the missing rows:
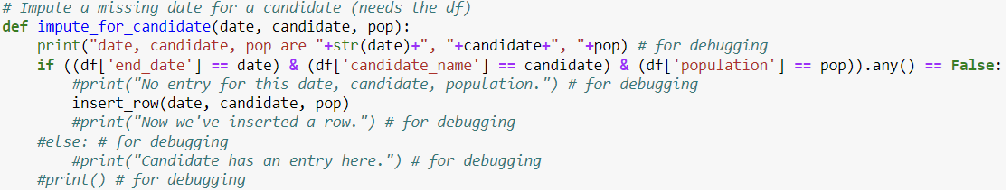
Then I used .bfill() to actually impute the missing averages. This function fills in the blanks with the previous row’s value. My new favorite method, .groupby came to the rescue again, but I had to get some help from StackExchange on this one.

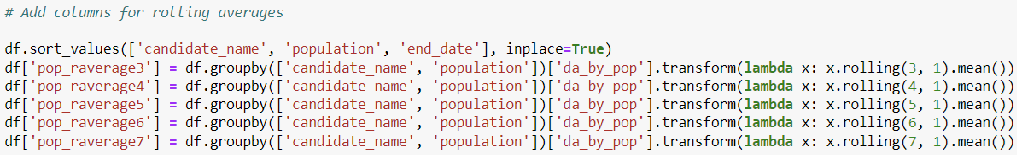
Then finally, my rolling averages. I actually computed them for windows from size 3 to 7.